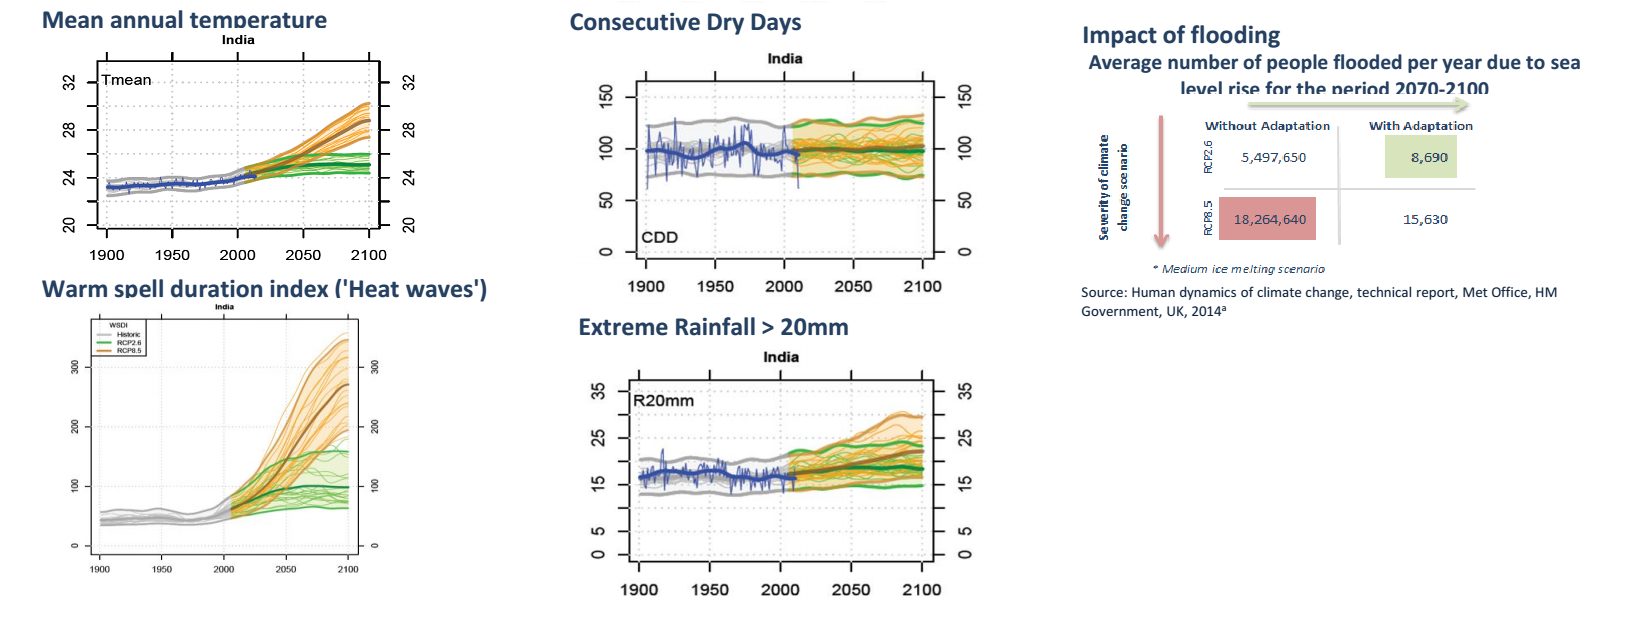
The average length of the longest dry spell, about 100 days, is not indicated to change much suggesting persistence of drought spells but with large year-toyear variability. At the same time, there is an indication that the number of days with very heavy precipitation may increase by around 5 days from 1990 to 2100 on average for RCP8.5. Some of the models indicate substantially larger increases - outside the range of observed variability, which implies an increase in fluvial flood risk.
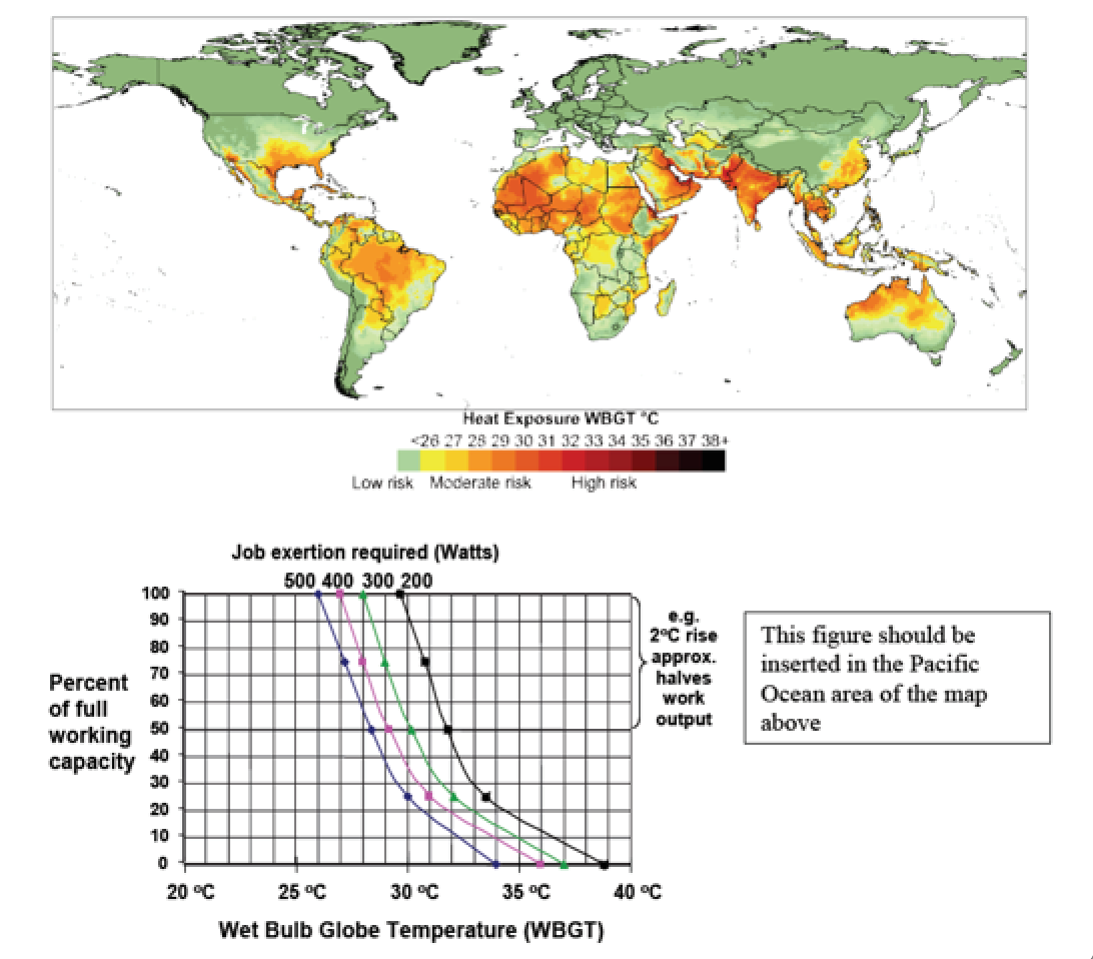
Under a high emission scenario (RCP8.5) heat-related deaths will increase to over 200,000 by 2080 compared to the estimated baseline of just over 4,000 deaths per year between 1961 and 1990. It should be noted, that the methods account for the high population growth rate in India. If global mean temperature rises 2 degrees Celcius approximately 14% annual daylight work hours would be lost by workers carrying out heavy labour, 400W (i.e. agricultural and industrial workers) this loss increases to over 20% with a 4 degree Celcius increase in global mean temperature.
Technical Explanation
The time series plots for climate indices are produced by first interpolating all observed and simulated data to a half degree grid and then aggregating from this to individual countries. The model projections are based on CMIP5 runs with multiple global climate models for RCP2.6 (green) and RCP8.5 (orange ). As well as showing the multi-model (ensemble) mean (based on about 20 different models), the 5% and 95% ranges are shown to indicate the range of uncertainty across the ensemble. For more information on RCP2.6 and RCP8.5 climate scenarios please see the methods page. For the indices of extremes, observations are taken from the HadEX2 dataset (www.metoffice.gov.uk/hadobs), whilst observed mean temperature (Tmean) is based on CRU TS (www.cru.uea.ac.uk/cru/data/hrg/).